2.4 KiB
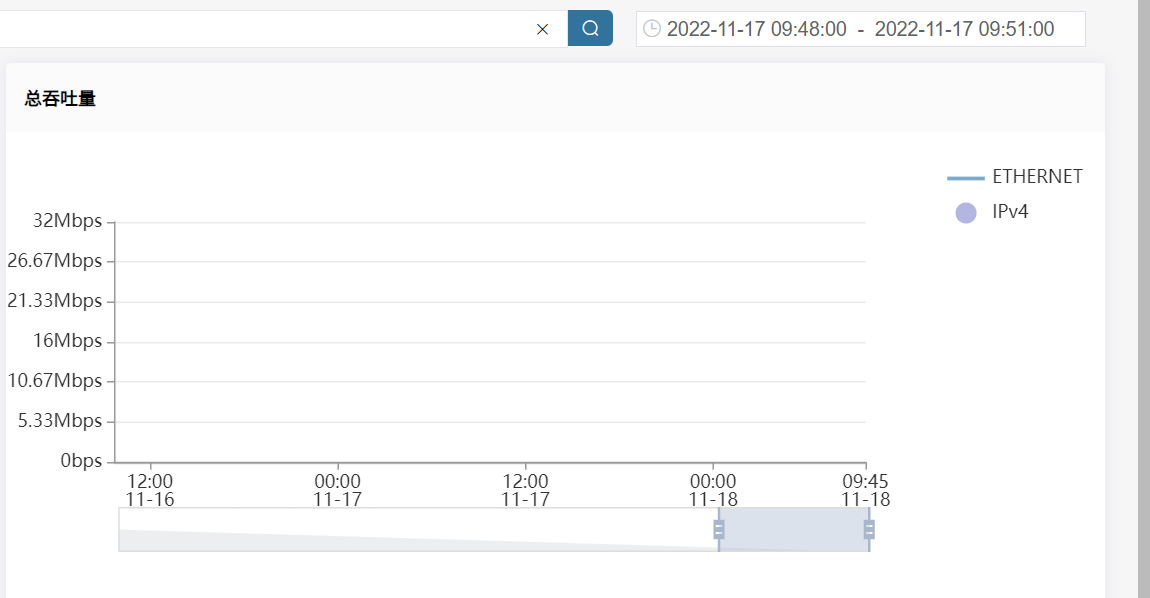
演示环境CM界面 实时流量图表 时间筛选后吞吐量图表显示不正常
| ID | Creation Date | Assignee | Status |
|---|---|---|---|
| OMPUB-701 | 2022-11-17T10:27:51.000+0800 | 王瑜 | 完成 |
因为演示环境负责监控办公网网络状况,有时排查故障需要按短时间筛选查看实时流量情况,发现如果筛选时间小于5分钟的时候,结束时间为00:01:00/00:11:00/00:21:00/00:31:00/00:41:00/00:51:00,以此类推的情况下,图中不显示数据。但是调整时间为00:02:00/00:12:00/00:22:00/00:32:00/00:42:00/00:52:00后就可以正常显示。
界面地址http://192.168.44.29/qidaijie commented on 2022-11-18T14:31:54.478+0800:
通过接口查看:
1:查询过去5分钟时粒度是15S,Throughput显示正常。
!livecharts接口1.png|thumbnail!
2:指定时间范围查询粒度是300S,Throughput显示异常,且图内时间轴变为了9.16 09:35 - 9.18 09:35。
!livecharts接口2.png|thumbnail!
结合上述情况,非数据相关问题。
yuwang commented on 2022-11-18T16:09:17.376+0800:
该问题是因为选择绝对时间时界面计算的时间粒度太大导致。在22.10版本中界面已对时间粒度进行的统计的计算和处理
Attachments
Attachment: image-2022-11-17-10-27-03-818.png

Attachment: image-2022-11-17-10-29-12-718.png

Attachment: image-2022-11-17-10-30-15-320.png
Attachment: image-2022-11-17-10-30-36-252.png

Attachment: livecharts接口1.png

Attachment: livecharts接口2.png
