1.6 KiB
1.6 KiB
新疆移动环境 Bifang21.10版本 tsg界面实时图表总吞吐量显示异常
| ID | Creation Date | Assignee | Status |
|---|---|---|---|
| OMPUB-291 | 2021-12-07T14:46:10.000+0800 | 王成成 | 已关闭 |
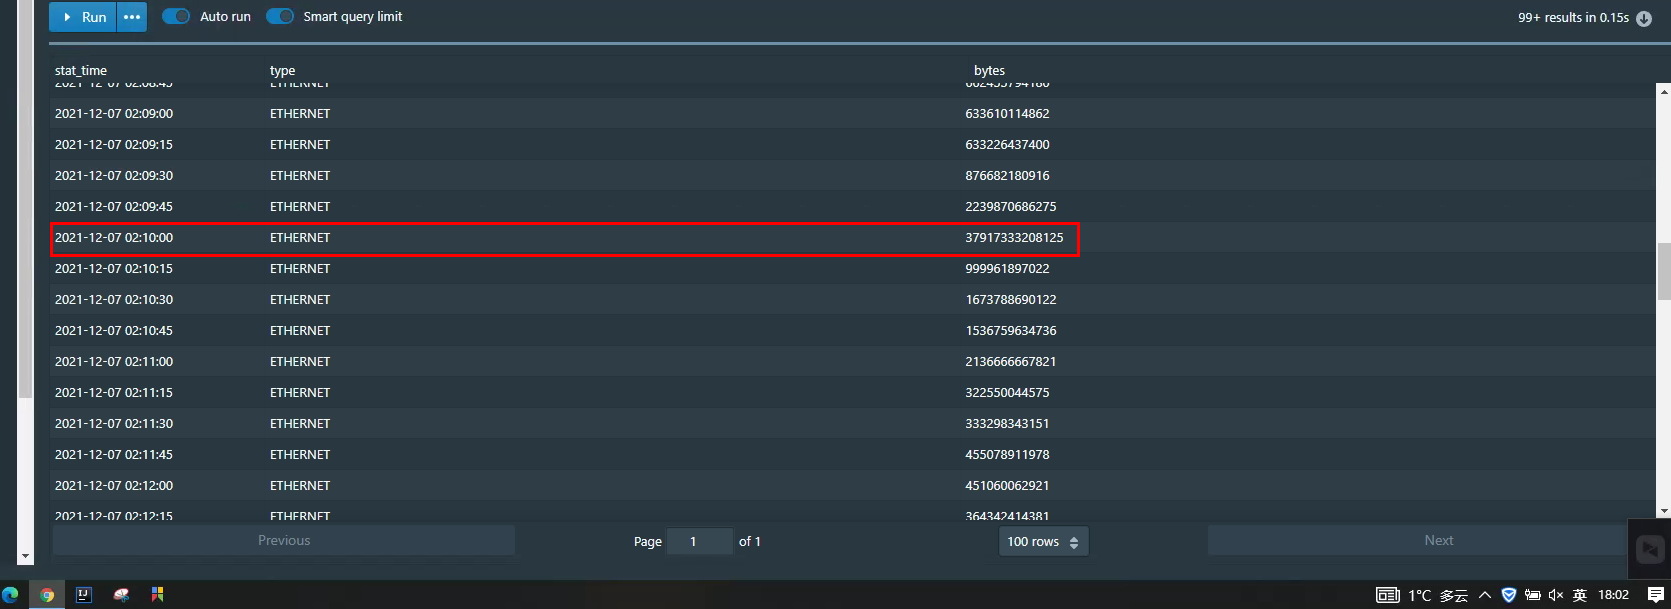
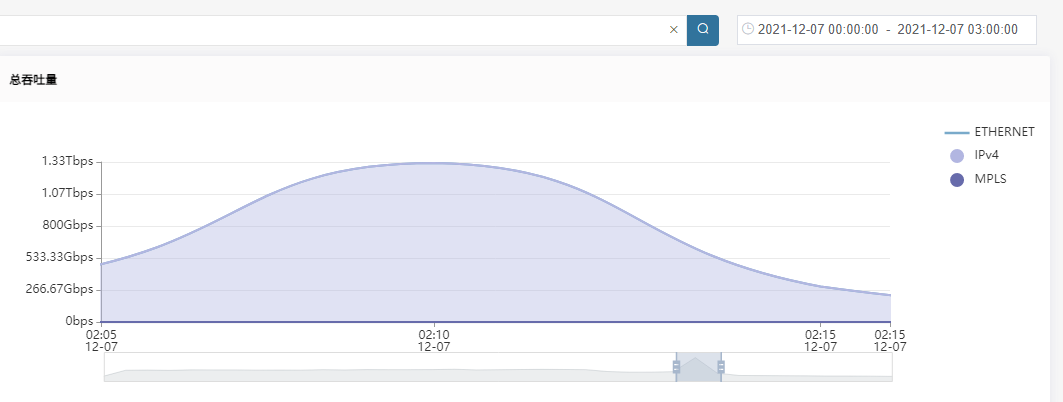
tsg界面仪表盘-实时流量图表-总吞吐量 时间范围默认12小时以内 12-07 02:10时图表显示数据量异常的大具体数值为20.22T;时间范围选择为一天时,12-07 02:10时图表显示数据量1.32T,时间范围选择为两天及以上时,12-07 02:10时图表显示数据量440G左右。doufenghu commented on 2021-12-07T18:16:05.743+0800:
图1,图2: 确认时间粒度是否与TSG-7014给出处理方案。
图3:峰值流量20.22Tbps 不符合常规,需要排查。
wangchengcheng commented on 2021-12-08T17:46:56.761+0800:
1.图3数据与druid表中数据一致,推断问题根源为livechart任务. 2.由于livechart任务目前在优化阶段,待其稳定后进行问题复现和排查.
Attachments
Attachment: 12.7凌晨2点10分druid表数据.jpg
Attachment: 默认12小时.png

Attachment: 选择1天.png
Attachment: 选择两天.png
